
In our innovation consulting and project coaching practice, we are repeatedly confronted with the desire of decision-makers to measure the performance of their innovation teams when applying design thinking (DT) (often for the first time). Even project or product teams themselves express this wish before the project starts as they are likely to be influenced by the widespread practice in large companies to measure, benchmark, and evaluate everything.
This situation presents us with various dilemmas, especially when working with companies that are just taking their first steps with agile working methods. Let’s look at two of these dilemmas:
Dilemma 01: In conversations with said managers, they ask about performance measurement without even the slightest understanding of what design thinking actually is and how it works. Often they also have no established operational innovation management as a foundation to build on. They implicitly hope that we might bring a silver bullet for measuring their teams to quickly achieve the success metrics they are used to from core business projects (ROI, NPV, etc.). There is often no awareness that such a silver bullet of measuring cannot exist, especially when innovating in the “Reshape the Core” and “Create the New” playing fields.
Dilemma 02: A “performance measurement” of innovation or design thinking teams must not only be different from the one used in the core business but also take into account the fact that many groups first have to learn the new agile behaviors and methods. In other words, the first projects are often more about creating “innovators” than “innovation”. Thus, the question arises, what should then be measured here and at what level, without doing injustice to the team. Because the truth is: it is exceedingly rare for teams to make “masterstrokes” in initial agile testing projects. The track record looks even more mixed in lighthouse projects rolled out with great fanfare.
So, we have a situation where managers who made a career by optimizing and improving efficiency in the core business, a.k.a. exploitation engine, and who have been socialized with the bastardized Drucker mantra “what gets measured, gets managed”, now will evaluate the work of exploration teams. If we as consultants don’t provide decision-makers with metrics and evaluation criteria better than those core business KPIs they know from the past, we will have failed to best help teams deliver their impact.
Faced with this reality in client work and inspired by thoughtful articles by Dan Toma, Esther Gons, and Tristan Kromer on innovation accounting, I had decided for some time to write a small series of blog articles on the topic. Fortunately, at the end of 2020, the GIZ approached us to collect suitable design thinking KPIs for an internal report, and I can now use the results of the working document created for this purpose. It is my preliminary attempt to illuminate the broad topic of “Innovation Accounting” once specifically with a design thinking filter. Let’s go.
The levels on which design thinking can be measured
Even though design thinking initially originated from the practice of industrial design it now gets applied to all kinds of problem spaces and challenges. This can range from small marketing messaging tweaks, internal process improvements, over CX/UX improvements and service design, to the design of new value propositions when creating new ventures and business models, to the design of interventions in organizational cultures, or even its application to societal transformation programs.
This means that each team has to measure something completely different, depending on what their subject of innovation is. Some teams focus on finding a value proposition for their users, while others try to introduce their colleagues to new ways of working (often design thinking itself) in learning experiences. It, therefore, is helpful to differentiate the levels on which you plan to intervene with your design thinking activity.

Each of the levels has a central question that drives its measurement. Not every stakeholder is equally interested in each of the levels. Especially top executives usually get informed only about project progress. Thus they don’t care personally about metrics on whether an individual or team performs well. In a similar vein, most teams are busy with their projects. Thus they don’t care as much about the ecosystem, program, or portfolio level metrics as managers do. The following table shows which role usually has an interest to measure on which level.
Who wants to measure what?
| Level | Main question that drives measurement | Team | Agile Discovery/ Delivery Coach, Scrum Master | Team Lead, Product Owner | Project Sponsor, BU Leader | Investment or Management Board |
|---|---|---|---|---|---|---|
| Ecosystem | Are we an innovative company? | ❌ | ❌ | ❌ | ❌ | ✅ |
| Program | Is the (culture change) program doing well? | ❌ | ❌ | ❌ | ❌ | ✅ |
| Portfolio | Is the portfolio doing well? | ❌ | ❌ | ✅ | ✅ | ✅ |
| Project | Is the project doing well? | ✅ | ✅ | ✅ | ✅ | ❌ |
| Team | Is this a good DT team? | ✅ | ✅ | ✅ | ❌ | ❌ |
| Individual | Is this a ‘good’ design thinker/innovator? | ✅ | ✅ | ✅ | ❌ | ❌ |
In a perfect world, of course — each of these levels would be of certain importance to everyone. For example, as an employee, you should care about your organization’s general innovation capability (program/ecosystem level), whereas the management board should at times also know how essential teams and projects are doing. In reality, however, we observed that this is not always the case so that in everyday life, each party or role tends to focus on its sphere of influence.
In the following pages, I will describe each level in more detail. I’ll also list frequently used measuring methods and indicators that you could use to measure at this level. Please note: in most experiment-driven agile approaches, we measure human behavior and attitude (our own and the one of the stakeholders we co-design and experiment with) in the hope that it predicts the financial results, which decision-makers care about the most. But measuring people and getting good, truthful data isn’t as easy as it seems. In most rather conventional organizations we rely on quantitative methods, mainly questionnaires. Quant methods, however, are often not appropriate for the context of early innovation endeavors. Amongst others, reasons for that are: respondents’ self-reporting might be biased by effects of social desirability and social approval, or, we might ask questions biased by our own assumptions, etc.
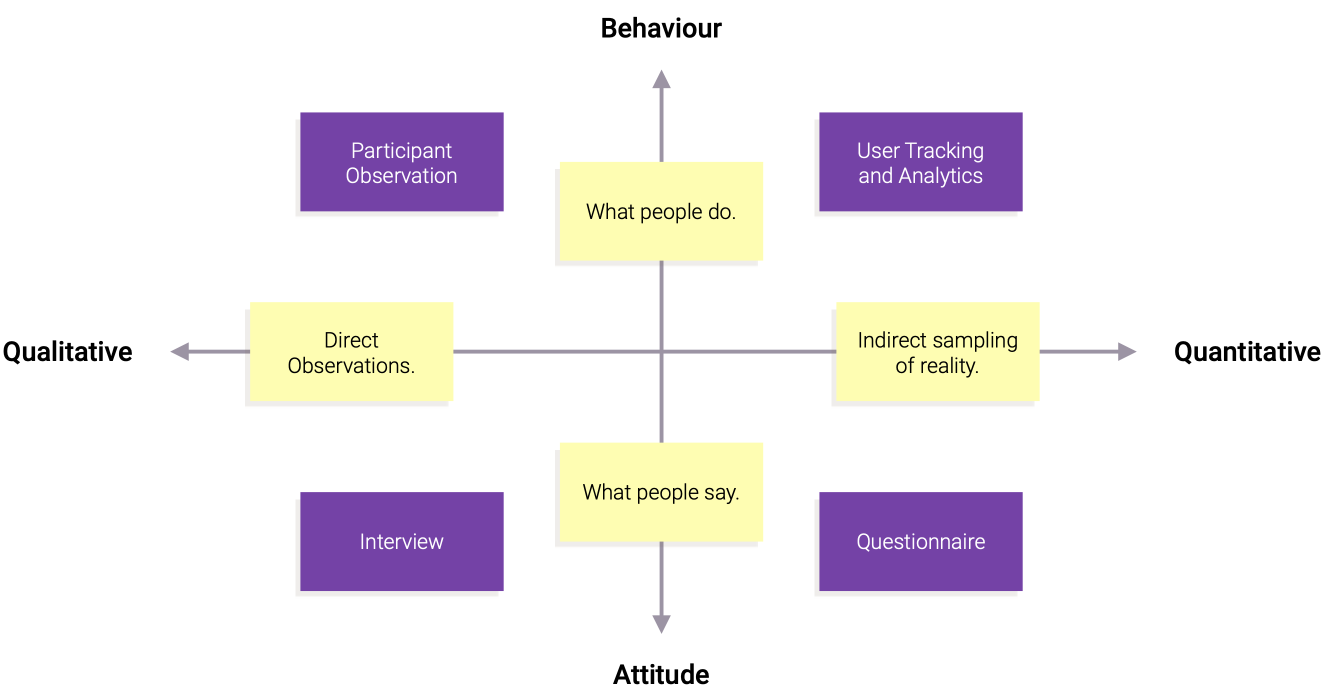
In agile work, we, therefore, complement such an indirect sampling of reality with direct observations of ourselves, users, and other stakeholders. And, we watch out not only for what they say but rather for what they do. This is what I mean by measuring human behavior. The experiments and methods we’ll have to apply for that, are pretty new to most organizations and are not the content of this post. In other words: I will give inspiration on what to measure but cannot show »how« within the scope of this article series.
Many design thinking and innovation teams are obliged to report to a variety of stakeholders and decision-makers as has been shown in the table above. Both mostly care about the impact and results of a team’s work, less so how it arrived there. In design thinking and other agile approaches, however, »smart failure is an option« as long as the team can show that it has failed reasonably and did everything that was in its power to make its intervention/project a success. This is why in innovation management, we differentiate and reference to two kinds of metrics, which should be separated in reporting :
Activity/input metrics
These kinds of metrics primarily focus on how busy a person, team/project, or company has been with innovation. They measure the level of innovation activity going on (e.g. number of new products launched, number of experiments run, ideas prototyped, team contributions made). They are leading indicators. If they look promising, they give both the team and their project sponsors the confidence that everything is on the right track and the project is making progress.
Impact/output metrics
These kinds of metrics measure the tangible project results that are emerging from above innovation activity. In for-profit environments revenue and profits are the ultimate measure of impact, followed by cost savings. In not-for-profit and public contexts this often is cost-savings and lives improved. For internally directed transformation initiatives, changes in attitude and behavior over time are the ultimate measure of impact. Yet, sometimes (in organizations, with a »the monetary bottom-line is measure of all things’ philosophy«) the latter are seen as activity metrics too. As it takes time until such signs become apparent, impact/output metrics need to be seen as lagging indicators.
Why is it important to differentiate these two kinds of metrics when measuring design thinking and innovation work on each of the levels? Because any desired output or impact of a project is confounded by so many variables (stakeholder dynamics and politics, internal org barriers, etc.) that it is impossible and also not meaningful to trace back the influence of a certain methodology like design thinking to a project’s success.
Nevertheless we at co:dify see that this is exactly what decision-makers want to have »proven« by their teams. Here teams will have to educate their project sponsors and try to show them better ways of evaluating their work in the future. I hope my collection of example metrics for each of the levels on the following pages will help with that.
Read about the first level here: Measuring the “performance” of individual design thinking team members.
References
